Case Study 1D – Mondogoal Forwards
To initiate this process we have categorised the different ways Mondogoal forwards can accumulate points based on their scoring matrix:
Goals (GLS)
Attacking Contribution – Assist, shots on target (and missed penalty kicks) (AC)
Discipline – Yellow cards, red cards and fouls committed (DIS)
Regular Play – Fouls won, minutes played and passes completed (REG)
Defensive duties have been ignored and even though you will often hear that old adage about defending from the front we feel that the scoring system is fair. The following pie charts compare consistency (CON) which is regular play and discipline aggregated, goals scored and other attacking elements for ALL games played as well as the Top 25 players in terms of average points per game up to and including round 37 of the 2014/15 season:
The general pattern suggests a fairly equal distribution across the 3 groups. The greatest fluctuations seem to be with the goals scored and there is a tendency for the higher ranked forwards to see a bigger proportion of their average points make up being accumulated as a result of hitting the back of the net.
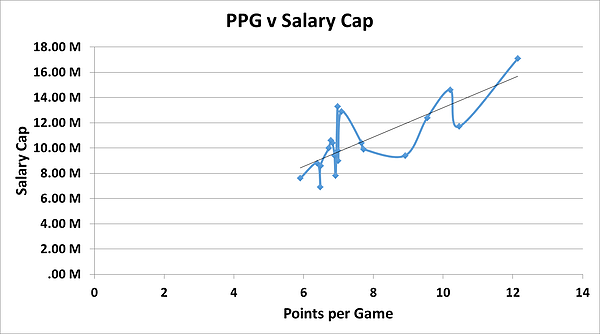
The following graph shows a clear correlation between the salary cap and the average points per game of the Top 20 ranked forwards with a minimum of 10 appearances for the same time period:

This graph enables you to predict how a forward should be valued so can be used as an aid for determining a value for money if you like to forecast how many points you believe a player will earn on any given match day.
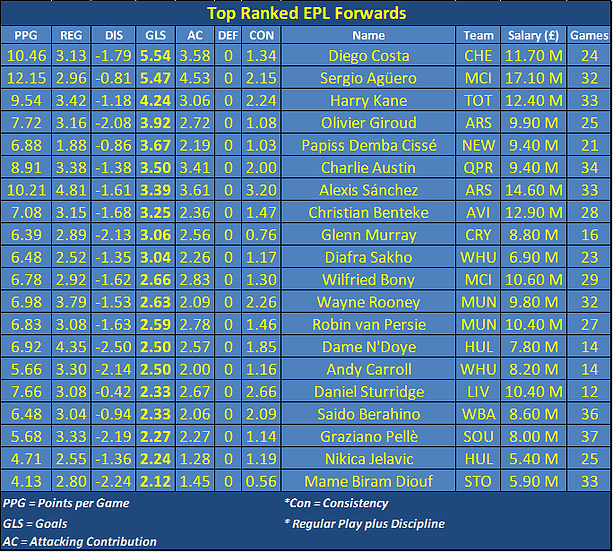
One concept worth bringing up at this point is the significance of standard deviation, a great indicator of a player’s reliability or erratic behaviour. Consistent performers will suit most events whereas knowledge of players who have the potential for big score fluctuations can come in handy in large field tournaments. Harry Kane, for instance set the Premier League alight last season but with approximately 45% of his points make-up down to goals scored as indicated in the following table which focuses on the Top 20 forwards ranked by average points earned from goals scored he is one player who would have a fairly high standard deviation. This is something we will look at in more detail in future articles but a reflection of how consistent his scoring is likely to be. His inclusion or not will probably boil down to the type of contest you are entering into as well as the other key points highlighted later.

To conclude here are some key indicators to look out for when selecting your forwards:
-
Team expectancies come to the forefront but try to gauge what percentage of a team’s goals a forward might contribute and what the predicted number of goals is for his team in this fixture compared with their goal average.
-
Watch out for players who give more than they get especially if the fixture looks volatile and a high card count is predicted.
-
Understand the specific traits of each player. Do they have a high shot frequency, like to run with the ball or have any set-piece responsibility?
-
Some forwards will perform much better in home games than they do in away games so factor this in if it applies. Defoe was a classic example in his early career at Spurs.
We’ve looked at each playing position so now it’s a case of knitting them all together to build a winning line-up that factors in the key fundamentals to success.

