
A Lion’s Share
FSPortal
- posted on
Last updated: 25 August 2026
Goal Involvement in Football: How to Calculate a Player’s Share of Goals and Assists
One of the most useful questions in fantasy football is not simply how many goals or assists a player has produced.
It is how much of their team’s attacking output they are responsible for.
Fantasy Sports Portal was using this idea more than a decade ago when comparing players across different teams and competitions. The basic principle remains valuable today and is commonly described as goal involvement or goal contribution percentage.
A player who contributes directly to a large percentage of his team’s goals may offer greater fantasy potential than another player with similar raw totals in a much stronger attacking side.
Why Goals and Assists Matter So Much in Fantasy Football
Fantasy scoring systems vary, but goals and assists remain among the most valuable actions across almost every format.
That makes projected team goals particularly useful.
If one team is expected to score considerably more than another, its attacking players naturally have more opportunities to generate fantasy returns.
But team projections only solve half of the problem.
Managers still need to determine which individual players are most likely to be involved in those goals.
What Is Goal Involvement Percentage?
Goal involvement percentage measures the proportion of a team’s goals in which a player has directly contributed either a goal or an assist.
A simple version of the calculation is:
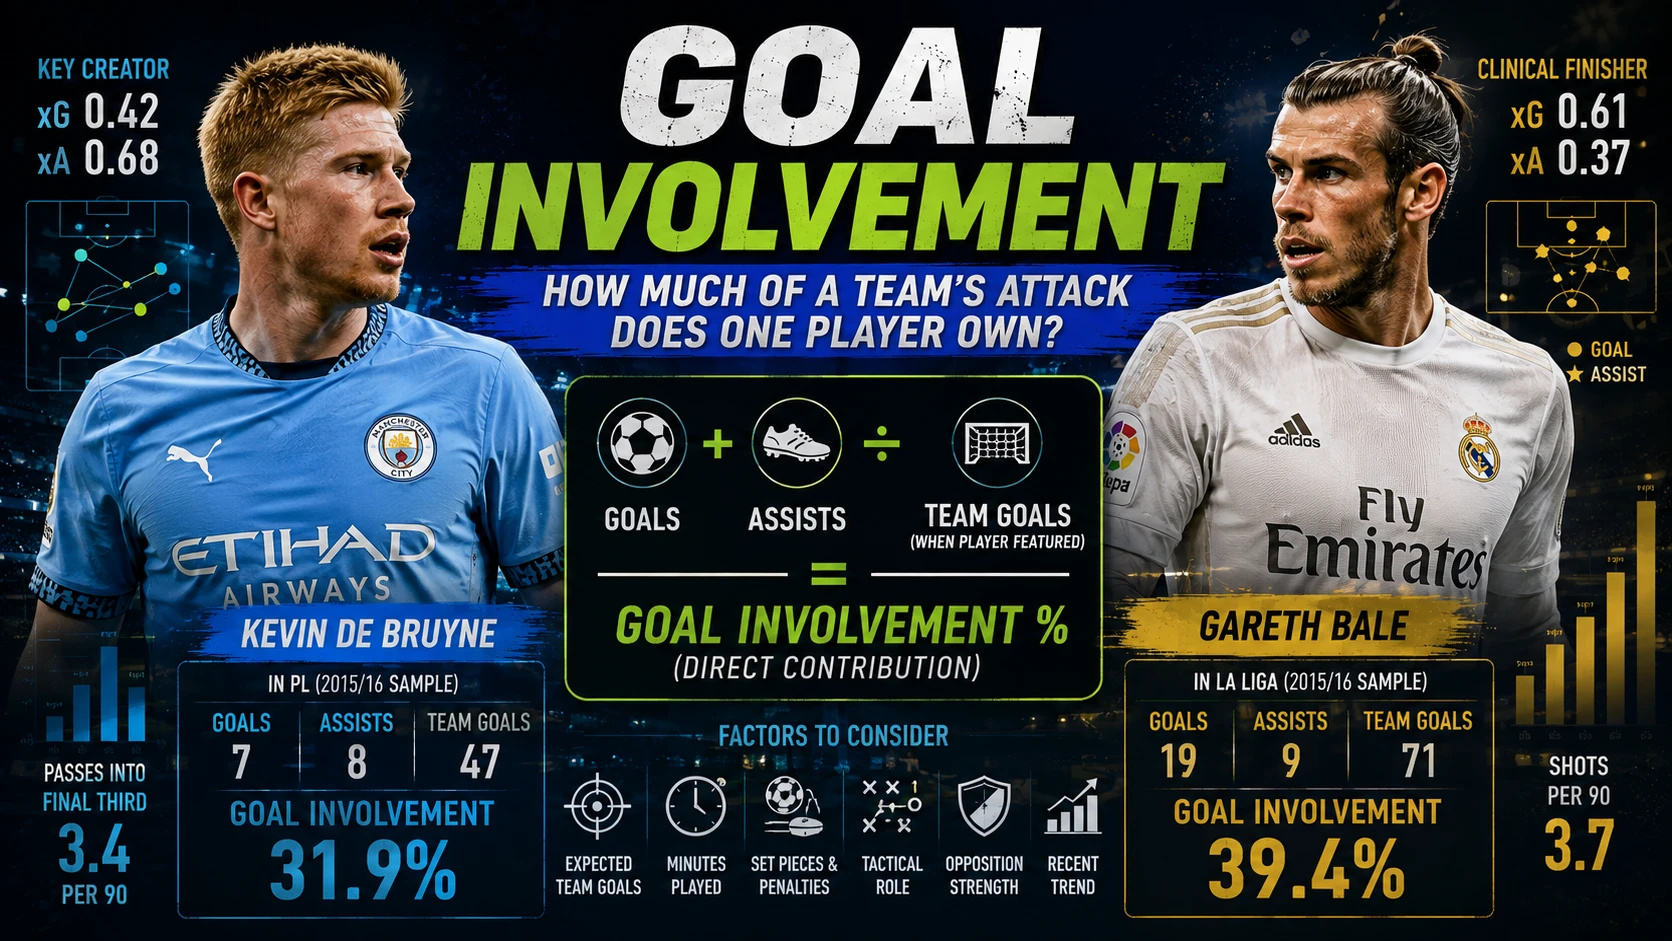
(Player Goals + Player Assists) ÷ Team Goals While Player Featured × 100
For example, suppose a player has scored 10 goals and supplied five assists while his team has scored 50 goals during the matches in which he appeared.
His direct goal involvement would be:
15 ÷ 50 = 30%
That means the player directly contributed to approximately 30% of his team’s goals during the relevant sample.
Why Raw Goals and Assists Can Be Misleading
Comparing players purely by totals can create misleading conclusions.
A forward with 20 combined goals and assists in a team that scores 100 goals is operating in a very different attacking environment from a player producing 20 in a team that scores only 50.
The first player has contributed directly to 20% of the team’s goals.
The second has contributed to 40%.
Both totals are identical, but the second player appears substantially more central to his team’s attacking output.
The Original Bale vs De Bruyne Example
We originally applied this idea before Manchester City’s Champions League semi-final against Real Madrid in 2016.
The fantasy selection question was whether Kevin De Bruyne or Gareth Bale represented the stronger attacking option.
At first glance, Bale held a substantial advantage in goals and assists despite having played fewer matches.
But comparing raw totals alone ignored the very different environments in which the two players operated.
Real Madrid were one of the highest-scoring sides in Europe, while Manchester City played in a Premier League that offered a different competitive context.
De Bruyne’s Share of Manchester City’s Goals
In the original sample, Manchester City had scored 47 goals in matches involving De Bruyne.
His combined goals and assists represented approximately 31.9% of those goals.
That was an impressive figure and demonstrated how central he had already become to City’s attacking output.
De Bruyne was not simply collecting occasional returns.
A significant proportion of City’s goals were passing through him.
Bale’s Share of Real Madrid’s Goals
Bale’s involvement was even greater.
Real Madrid had scored 71 goals across his 21 starts in the original sample, while his combined goals and assists accounted for approximately 39.4% of that attacking output.
That was particularly notable in a team containing Cristiano Ronaldo and several other elite attacking players.
The numbers suggested Bale was not simply benefiting from Real Madrid’s enormous goal totals.
He was directly responsible for a significant share of them.
Why Competition Strength Matters
Cross-league comparison adds another layer of difficulty.
A player dominating one domestic competition may encounter substantially different opponents in European football.
This was particularly relevant when comparing Real Madrid’s La Liga output with Manchester City’s Premier League performances.
Domestic statistics therefore provide evidence rather than certainty.
Fantasy managers still need to account for:
- opposition quality;
- likely possession;
- expected team goals;
- tactical role;
- home or away advantage;
- set-piece responsibility; and
- expected minutes.
Goal Involvement and Expected Goals
Modern football analysis provides considerably more information than was widely available when this article was first published.
Expected goals (xG) measures the quality of scoring opportunities, while expected assists (xA) estimates the likelihood that a pass will become an assist.
Those metrics can be combined with goal involvement to build a stronger picture of a player’s attacking importance.
For example, a player may have a high historical goal involvement percentage but relatively weak underlying xG and xA numbers.
That could indicate that recent returns are unlikely to continue at the same rate.
Alternatively, a player with strong xG and xA but modest actual returns may be producing better performances than his current fantasy points suggest.
Goal Involvement vs Goal Dependency
A very high goal involvement percentage can also tell us something about the team itself.
If one player contributes directly to half of a team’s goals, that player may be exceptionally valuable.
But it can also indicate that the team is heavily dependent on one attacker.
This matters when evaluating sustainability.
If the player is injured, suspended or loses form, does the team possess alternative routes to goal?
Goal involvement therefore has tactical value beyond fantasy football.
How Fantasy Managers Can Use Goal Involvement
The metric works best when combined with context rather than used as a standalone ranking.
Useful questions include:
- What percentage of team goals does the player contribute to?
- Is that involvement increasing or decreasing?
- Does the player take penalties or set pieces?
- Is the player starting consistently?
- How many goals is the team expected to score?
- Do the player’s xG and xA support the actual returns?
- Is the upcoming opposition stronger or weaker than usual?
Those questions provide a much better framework than simply selecting whichever player has scored the most goals recently.
A Simple Example
Imagine two fantasy midfielders:
- Player A: 8 goals, 8 assists, team scored 80 goals.
- Player B: 7 goals, 6 assists, team scored 40 goals.
Player A has 16 direct contributions from 80 team goals:
20% goal involvement
Player B has 13 contributions from 40:
32.5% goal involvement
Player A has the better raw numbers.
Player B appears far more important to his team’s attack.
Depending on the upcoming fixtures and fantasy prices, that distinction could materially influence which player represents better value.
Why This Old Fantasy Football Idea Still Matters
The terminology surrounding football analytics has changed considerably since this article was first published.
Fantasy managers now routinely discuss xG, xA, expected minutes, shots in the box, big chances and numerous other metrics.
But the fundamental idea behind our original Bale and De Bruyne comparison remains the same.
Do not simply ask how many attacking returns a player has produced.
Ask how important that player is to the goals his team is likely to score.
That is what goal involvement helps measure.
And for fantasy football managers trying to predict future points rather than simply describe past ones, that distinction remains extremely useful.
Explore more: Football and fantasy analysis from Fantasy Sports Portal.

